Phase Diagram of Traffic Patterns
The observed spatiotemporal patterns of congested traffic flow can be categorized by a dynamic phase diagram, thereafter shortly called phase diagram (although it is not a phase diagram in the thermodynamic sense). The phase diagram denotes the qualitative spatiotemporal properties of a given congested region as a function of the traffic demand, and the bottleneck strength (see also the section on "phenomena"). Furthermore, the phase diagram depends on the stability properties of the traffic flow which, in turn, are influenced by the real or simulated driving style, i.e., by the type and the parameters of the traffic flow model.
Stability of Traffic Flow
The following phenomenon is known to every car driver: If the driver of the leading vehicle brakes (for whatever reason), and there is no possibility to change lanes and overtake, one must brake as well in order to avoid a rear-end collision. However, during the reaction time and the subsequent deceleration time, one keeps approaching the leading vehicle. As a consequence, the new distance gap to the leader may be smaller than the new safety gap, although the latter is reduced with the reduced speed. This happens especially if
- the road is sufficiently crowded,
- and the driver's responsiveness (agility) is low.
If the new gap is smaller than the new safety gap, it is necessary to
From this mechanism, it follows that this "vicious cycle" can be broken by
- a high responsiveness and an agile driving style,
- anticipative driving,
- and a sufficient safety gap.
Furthermore, it is evident that this mechanism is not effective if there is only light traffic: In this case, a given follower has "equilibrated" his or her distance gap during the time the next follower needs to approach within interaction distance.
Different Stability Categories
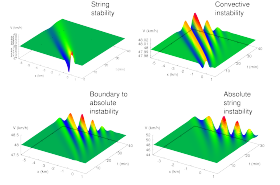
The figure to the left illustrates this mechanism by showing the spatiotemporal evolution of the average local speed of a long platoon of identical vehicles following each other in dense traffic. At time t=0, a small perturbation has been introduced to the vehicles near the location x=0 (which may be caused by lane changes, nonperfect driving styles, or other). Depending on the agility of the drivers, different types of traffic instabilities occur (the density and the initial speed is the same in all four simulations):
- High agility (top left): The initial perturbation vanishes: Traffic is string stable.
- Moderate agility (top right): The traffic oscillations increase. However, they propagate only in the upstream direction. Consequently, at the location of the initial perturbation, the oscillations fade away after some time. If there is no further perturbation, the waves eventually are "convected out" of the considered road section. This mild form of string instability is called (upstream-) convective instability.
- Low agility, sluggish driving style (bottom right): The oscillations grow and propagate in both directions. Sooner or later, there are oscillations everywhere even if there is no further perturbation.
- The limiting case between these two stability types (moderate to low agility) is shown in the image on the bottom left.
Stability Diagram
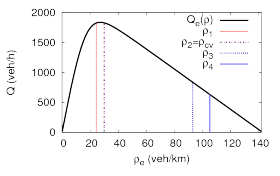
Stability Diagram for rather agile drivers
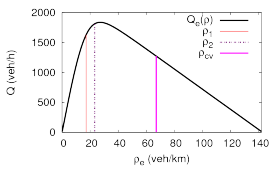
Stability Diagram for rather sluggish drivers
Besides the driving style, the stability depends on the traffic density. Furthermore, the traffic density is related to the local speed and the local flow (vehicles per time unit and per lane) by the so-called fundamental diagramm. Both relations can be illustrated by a so-called stability diagram:
In each diagram (the left one is for more agile, and the right one for more sluggish drivers), the black curve denotes the local flow as a function of the local density (fundamental diagram). Furthermore, the stability regions with respect to density are separated by the vertical coloured lines denoting the following:
- Traffic is absolutely stable to the left of the red line (density ρ < ρ1, free traffic) and to the right of the blue line (ρ > ρ4, nearly standing traffic). Notice that there is no blue line in the right diagram corresponding to the less agile drivers, i.e., traffic flow does not "restabilize" in this case (at least if there is not a complete standstill corresponding to "stable" traffic, for trivial reasons).
- Traffic is convectively unstable inside the density region bounded by the violet dotted (left) or solid (right) lines (density ρ= ρcv), and the blue dotted lines (ρ= ρ3).
- Traffic is absolutely string unstable inside the density region bounded by the violet dotted (density ρ= ρ2) and solid lines (ρ= ρcv). Notice that this instability type only exists for the more sluggish drivers.
- Finally, there exist regions of nonlinear instability or metastability. Therefore, only strong perturbations lead to (generally convective) instabilities while small perturbations fade away.
→to the top
From the Stability to the Phase Diagram
The stability diagram as discussed above has been developed for an infinite homogeneous road section. However, all real road networks are inhomogeneous. Furthermore, as illustrated by the image data base, traffic breaksdowns occur near bottlenecks in the overwelming majority of all cases. The decisive attribute of a bottleneck is its bottleneck strength which is defined by the local reduction of the capacity with respect to the neighboring sections, or, equivalently, by the local capacity at the bottleneck, i.e., the maximum mainroad traffic flow that can pass the bottleneck without causing congestions. Consequently, the flow of congested traffic behind a bottleneck is determined by the bottleneck capacity. (More precisely, there are two bottleneck capacities, one for free flow, and one after breakdown, i.e., after "activation" of the bottleneck, that are separated by the so-called capacity drop. However, this distinctiopn is not relevant here.)
This means the controlling variable in real congestions is not the density but the flow. Consequently, in order to derive the phase diagram of traffic patterns in open systems, one must swap the x and y axes of the stability diagram. However, the inversion is not unique since, for a given flow, there are two (or zero) values of the density. This ambiguity can be resolved by taking care of the direction of information propagation of traffic flow:
- For free traffic, the information direction is pointed downstream and the flow is determined by the mainroad traffic demand entering the system. The density and the corresponding instability type can be read from the free branch of the stability diagram to the left of the flow maxium.
- After a breakdown, the information direction is pointed upstream and the flow of the congested traffic is determined by the bottleneck capacity. The density and the corresponding instability type can be read from the congested branch of the stability diagram to the right of the flow maximum.
As a consequence, the stability of traffic in realistic open systems with bottleneck depends on the traffic demand, the bottleneck strength, and the driving style. Each stability type results in different characteristic spatiotemporal properties of the congestion after a breakdown has occurred:
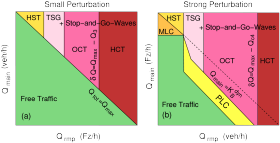
Phase diagram of moderately agile drivers
Each of the resulting patterns is also called a dynamic phase. The systematic plot of the dynamic phases as a function of the exogeneous variables traffic demand, bottleneck strength, the severity of the perturbation, and the driving style parameters, is also called a phase diagram.
The depicted phase diagrams display the traffic phases as a function of the onramp bottleneck strength (which essentially is given by the onramp inflow Qrmp), and the traffic demand Qmain on the main road. These phase diagrams represent the real situation for most freeways, including the freeway section shown in the image database. The congested traffic patterns can be explained as follows:
- Free traffic: This is the case if the road network can handle the traffic demand, i.e., the sum of the main and ramp inflows is below the capacity of the freeway downstream of the bottleneck, Qmain + Qrmp < Qmax.
- Isolated moving jams (moving localized clusters, MLC): This pattern may emerge if free traffic flow is in the metastable density range and there is a strong local perturbation in the traffic flow. In theory, no bottleneck is necessary for this type of pattern. In reality, however, a perturbation of sufficient strength can only be realized if a moving perturbation inside the traffic flow (such as an inconsiderate lane-changing maneuver or "running elephants") crosses a bottleneck, see "three ingredients to make a jam"
- Homogeneous lightly congested traffic (homogeneous synchronized patterns, HST): This type of pattern emerges for small bottlenecks and sufficient traffic demand (otherwise, there is no breakdown at all), if the resulting density on the congested branch of the stability diagram is below ρ2. Since this condition implies congested traffic with comparatively low densities and high flows, this pattern can only be obtained for small bottlenecks.
- Stop-and-go traffic (triggered stop-and-go waves, TSG, and
oscillating congested traffic, OCT): This pattern emerges
if the inflow is sufficiently high for causing a traffic
breakdown, and the bottleneck strength is in a (medium) range
such that the resulting congested traffic is convectively
unstable. Since the oscillations grow only in the upstream direction,
traffic is nearly homogeneous near the bottleneck, and
oscillatory further upstream. However, unlike the idealized case
considered in the stability diagram, the perturbations near the
bottleneck (merging zones) are sustained. Consequently, the
oscillations will not be convected away completely.
Practical hint: If you are stuck inside a traffic congestion and experience distinct traffic oscillations, you are in bad luck since you probably are yet far away from the bottleneck. On the other hand, If there are no distinct oscillations, you may hope to pass the bottleneck (i.e., the end of the jam) in a short while!
- Homogeneous heavily congested traffic (HCT): This happens for strong bottlenecks leading to strongly congested flow whose density is above ρ3 (only strong perturbations may lead to stop-and-go waves), or above ρ4 (absolutely stable). Notice that such a density range does not exist in all models for all parameter ranges. Moreover, it cannot be observed conclusively in real data. Consequently, the existence of HCT is controversial.
- Standing jam waves (pinned localized clusters, PLC): This is a consequence of the metastability, and also of the capacity drop mentioned above.
Simulating the Phase Diagram
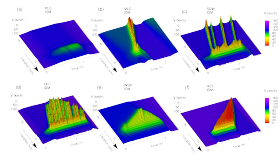
Congested traffic patterns simulated with the Intelligent Driver Model (IDM)
This diagram has been generated by simulating the Intelligent-Driver-Model (IDM) with the model parameters v0=120km/h, T=1s, s0=2m, a=1m/s2, b=1.5m/s2, corresponding to the stability diagram of the rather agile drivers, and the phase diagram of the previous section.
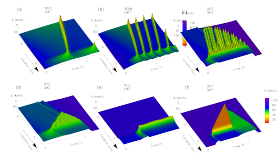
Congested traffic patterns simulated with the Gas-kinetic based traffic model (GKT model)
Since the derivation of the phase diagram applies for any
traffic flow model provided this model produces stability
diagram such as these of Section 2,
it must be also valid for suitable macroscopic models. In fact,
traffic patterns produced with the
Gas-kinetic based traffic model (GKT model)
(see the figure above), and the corresponding phase diagram, shows no
qualitative differences.
Reality Check: Empirical Traffic Patterns
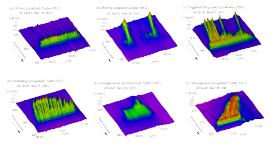
Traffic patterns on the freeway A5 corresponding to the phases of the phase diagram
Of course, the real test of all these concepts consists in comparing the predictions of the theories and models with the observed patterns. In fact, all characteristic traffic patterns can be found after reconstructing the real spatiotemporal dynamics with a dedicated method: All patterns of the figure to the left are taken from the image database. Notice, however, that the majority of the observed congestions (including that showed at the beginning of this page) are composite patterns containing several of the elementary patterns defining the traffic phases. See the stylized facts for further discussion of this point.
→to top
References
- Martin Treiber, Arne Kesting, Dirk Helbing:
Three-phase traffic theory and two-phase models with a fundamental diagram in the light of empirical stylized facts,
Transportation Research Part B: Methodological 44(8-9), 983-1000 (2010).
Abstract,
Preprint.
- Martin Treiber, Arne Kesting:
Evidence of convective instability in congested traffic flow: A systematic empirical and theoretical investigation
Transportation Research Part B: Methodological, Transportation Research Part B: Methodological 45, Issue 9, 1362-1377 (2011).
Abstract
- Dirk Helbing, Martin Treiber, Arne Kesting, Martin Schönhof:
Theoretical vs. Empirical Classification and Prediction of Congested Traffic States,
The European Physical Journal B 69, 583-598 (2009).
Abstract,
Preprint.
- Dirk Helbing, Ansgar Hennecke, Martin Treiber:
Phase Diagram of Traffic States in the Presence of Inhomogeneities,
Physical Review Letters 82, 4360-4363 (1999).
Abstract,
Preprint.

